
Girls Wrestling Growth by State: NFHS Data
By the Smart Wrestler team · Original planning resources and source review · Updated 2026-10-20
Compare verified NFHS girls wrestling participation for 2024–25 and 2025–26, with state counts, transparent growth calculations and a downloadable dataset.
Quick answer
NFHS reported 88,771 girls participating in high-school wrestling in 2025–26, compared with 74,064 in 2024–25. The increase is 14,707 participation entries, or 19.9% rounded to one decimal place. The state table below transcribes the girls wrestling columns from the two official surveys and shows the calculation for every jurisdiction. These are school-sport survey counts, not a census of all wrestlers, club membership totals or evidence that an event is available nearby.
What does the national increase actually measure?
The comparison describes reported participation in education-based high-school girls wrestling across consecutive NFHS survey years. Subtracting the earlier total from the later total gives 14,707 additional participation entries. Dividing that change by 74,064 produces about 19.9 percent. This is a calculation from published counts, not a forecast of future growth or a measurement of website search demand. The dates refer to school years rather than calendar-year tournament seasons.
Keep the population clear when using the figures. A high-school participation survey does not measure every youth club, adult participant or international athlete. It also does not establish how many local tournament entries are available to a particular family. When discussing program planning, use the national number as context and inspect the relevant state and local evidence separately. A growing national total can coexist with limited competition choices in an individual town.
How should you read the state comparison?
Read absolute change alongside percentage change. A smaller starting count can produce a large percentage movement from a modest numerical increase, while a larger program can add many participants with a lower percentage change. Neither measure alone establishes program quality or an athlete’s opportunity. The table uses the same published jurisdiction labels across both reports and retains the District of Columbia as its own row rather than treating the dataset as exactly fifty rows.
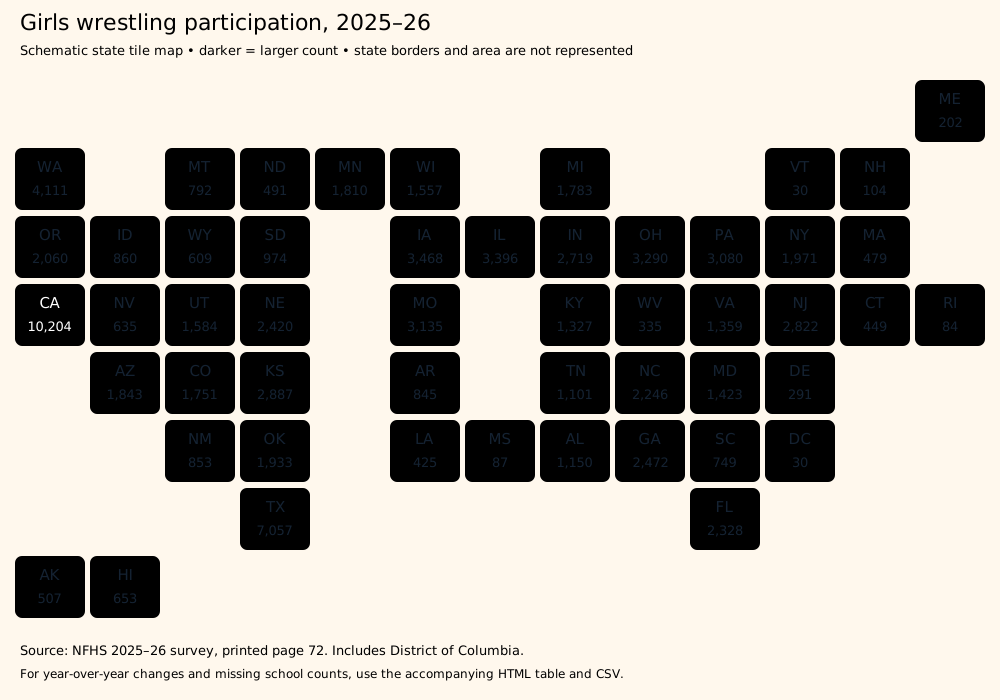
The CSV also preserves published school counts where available. An empty school-count cell remains unknown rather than becoming zero. West Virginia’s 2024–25 girls participation cell is blank in the source, so its change and growth rate are not calculated. Participation values and school values are different variables, so do not infer a number of teams by dividing one casually by the other. The visualization emphasizes current participation scale, while the table carries the two-year comparison. Its equal-sized tiles use schematic geographic placement rather than actual state boundaries. They do not indicate places where the platform operates events.
| Jurisdiction | 2024–25 | 2025–26 | Change | Growth |
|---|---|---|---|---|
| Alabama | 916 | 1150 | 234 | 25.5% |
| Alaska | 621 | 507 | -114 | -18.4% |
| Arizona | 1677 | 1843 | 166 | 9.9% |
| Arkansas | 683 | 845 | 162 | 23.7% |
| California | 8831 | 10204 | 1373 | 15.5% |
| Colorado | 1326 | 1751 | 425 | 32.1% |
| Connecticut | 357 | 449 | 92 | 25.8% |
| Delaware | 86 | 291 | 205 | 238.4% |
| Dist. of Columbia | 24 | 30 | 6 | 25.0% |
| Florida | 2130 | 2328 | 198 | 9.3% |
| Georgia | 2095 | 2472 | 377 | 18.0% |
| Hawaii | 616 | 653 | 37 | 6.0% |
| Idaho | 848 | 860 | 12 | 1.4% |
| Illinois | 2678 | 3396 | 718 | 26.8% |
| Indiana | 2224 | 2719 | 495 | 22.3% |
| Iowa | 2990 | 3468 | 478 | 16.0% |
| Kansas | 2706 | 2887 | 181 | 6.7% |
| Kentucky | 620 | 1327 | 707 | 114.0% |
| Louisiana | 15 | 425 | 410 | 2733.3% |
| Maine | 158 | 202 | 44 | 27.8% |
| Maryland | 1076 | 1423 | 347 | 32.2% |
| Massachusetts | 353 | 479 | 126 | 35.7% |
| Michigan | 1505 | 1783 | 278 | 18.5% |
| Minnesota | 1376 | 1810 | 434 | 31.5% |
| Mississippi | 61 | 87 | 26 | 42.6% |
| Missouri | 2987 | 3135 | 148 | 5.0% |
| Montana | 670 | 792 | 122 | 18.2% |
| Nebraska | 2098 | 2420 | 322 | 15.3% |
| Nevada | 510 | 635 | 125 | 24.5% |
| New Hampshire | 96 | 104 | 8 | 8.3% |
| New Jersey | 2229 | 2822 | 593 | 26.6% |
| New Mexico | 763 | 853 | 90 | 11.8% |
| New York | 1442 | 1971 | 529 | 36.7% |
| North Carolina | 1917 | 2246 | 329 | 17.2% |
| North Dakota | 506 | 491 | -15 | -3.0% |
| Ohio | 2535 | 3290 | 755 | 29.8% |
| Oklahoma | 1519 | 1933 | 414 | 27.3% |
| Oregon | 1809 | 2060 | 251 | 13.9% |
| Pennsylvania | 2510 | 3080 | 570 | 22.7% |
| Rhode Island | 101 | 84 | -17 | -16.8% |
| South Carolina | 344 | 749 | 405 | 117.7% |
| South Dakota | 476 | 974 | 498 | 104.6% |
| Tennessee | 1061 | 1101 | 40 | 3.8% |
| Texas | 7147 | 7057 | -90 | -1.3% |
| Utah | 1558 | 1584 | 26 | 1.7% |
| Vermont | 13 | 30 | 17 | 130.8% |
| Virginia | 913 | 1359 | 446 | 48.8% |
| Washington | 3457 | 4111 | 654 | 18.9% |
| West Virginia | Not reported | 335 | Not reported | Not calculated |
| Wisconsin | 916 | 1557 | 641 | 70.0% |
| Wyoming | 515 | 609 | 94 | 18.3% |
Women’s wrestling weight classes differ by school, college and international competition. Compare the lists, units and division checks before entering. Girls and women’s weight classes.
How was the dataset checked?
The source records are the girls wrestling columns on printed page seventy-two of each linked survey. Those pages occur at different positions in the PDF files, so printed page labels and document years matter more than assuming the same file-page index. Values were extracted by their column positions to avoid confusing wrestling with adjacent volleyball or track data. The resulting fifty-one jurisdiction rows were then summed and checked against the published national participation totals for both years.
This reconciliation is an important check, but it does not make the survey a different kind of dataset. Reported values can reflect the collection process and definitions in the source. The downloadable file records the original year counts and the derived change rather than replacing them with a rank alone. Anyone reusing the data can reproduce the arithmetic. Keep the source links and school-year labels attached when quoting a value or creating a chart from the CSV.
Choose a first-season girls wrestling program by checking instruction, training partners, competition access and practical family communication. First-season girls wrestling.
How can readers reproduce or challenge the state growth comparison?
Use the downloadable data as a starting point, then reproduce the source extraction for the states relevant to your question. A blank is different from zero. Record both years and the measure before calculating change, and keep school participation reporting separate from claims about clubs, local opponents or a family’s chance of finding an event.
| Planning field | Prompt or example to adapt | Your entry |
|---|---|---|
| Source identity | Record each NFHS survey edition, the girls wrestling table and the printed page reference used for extraction. | __________ |
| State values | Transcribe the two participant counts for the same jurisdiction; leave an unreported prior value missing. | __________ |
| Absolute change | Subtract the earlier reported count from the later one only when both values are available. | __________ |
| Growth calculation | Divide that difference by the earlier reported count; state the denominator and avoid a percentage when it is unavailable. | __________ |
| Interpretation limit | Describe reported high-school participation, not unique all-age wrestlers, local event inventory or guaranteed future growth. | __________ |
What conclusions are useful for clubs and families?
A club can use the comparison to frame questions about local program development, coaching capacity and event access. The data does not answer those questions by itself. Check the actual programs serving your area, how beginners are introduced and which current competitions accept the athlete’s eligibility group. A state with a large participation count can still require substantial travel for a particular format or experience level.
For families, treat the growth story as encouragement to investigate opportunities rather than a promise that every tournament will have a suitable bracket. Ask organizers directly about the current event’s divisions and registration. For hosts, compare confirmed local interest with the operational capacity to provide a useful competition experience. Avoid using state participation totals as if they were a ready-made registration forecast. The practical next step is a verified conversation with local programs and an inspection of current event information.
How should this study be updated and reused?
Update the dataset when the next official survey is available, preserving the earlier source years and documenting any changed definitions. Do not silently replace values while leaving an old chart title. Recalculate totals, differences and percentages from the new source rather than copying a headline growth rate. If a correction is identified, explain which value changed and retain enough provenance for a reader to understand the revision.
Reuse the CSV with clear attribution and school-year labels. Describe the visualization as a schematic geographic state tile map rather than a precise geographic map. Keep missing school data distinguishable from zero, and avoid rounding the original participation counts. The current resource is useful because it connects a reproducible national calculation to every jurisdiction’s underlying values. It supports transparent discussion of girls wrestling participation while leaving eligibility, medical decisions, program quality and actual tournament availability to their appropriate current sources.
Frequently asked questions
Can the state with the highest percentage growth be called the largest program?
No. Percentage change describes movement relative to the earlier count, while current participation describes scale. A smaller starting count can produce a large percentage increase. Compare both measures before drawing a conclusion.
Why is West Virginia’s growth shown as not reported?
The earlier girls participation value in the source table is blank. Treating that blank as zero would invent a baseline and make the growth calculation misleading. The current count can still be shown without assigning an unsupported change.
Do these figures prove more girls tournaments are available near my town?
No. State-level school participation is not an event inventory or a travel-distance measure. Use the data for reporting context, then verify current local competition categories and entry availability directly with the relevant hosts.
Sources
- NFHS 2025–26 participation survey, printed page 72
- NFHS 2024–25 participation survey, printed page 72
- NFHS participation survey archive
Sources checked 2026-10-20.
Keep exploring
Put this plan to work
Use the relevant reference or tool to organize your next wrestling event.